itrace example
The itrace example illustrates how to use the itrace library to monitor CPU and DSP activity using various profiling events.
Overview
The example illustrates how to perform the following actions:
-
Start a logger instance from the CPU
The itrace logger is initialized by calling
itrace_open_logger. The logger is responsible for parsing the logs captured on the CPU and DSP and producing CSV and JSON files describing the CPU and DSP activity.Note: Starting a logger instance from the DSP is currently not supported.
-
Start a profiler instance on the CPU and DSP
These two tasks are accomplished by calling
itrace_open_profilerwith the desired target domain and log buffer size. DSP domains are specified using theremotedomain predefined constants such asCDSP_DOMAIN_IDwhile the CPU domain may be specified with the itrace constantCPU_DOMAIN_ID. -
Specify which events to monitor
The user calls one of the
itrace_add_eventflavors to specify which events to monitor on which domain. Using the-for--load_events_from_filecommand-line argument illustrates how events may be added from files, while using-aor--monitor_all_pmu_eventsflag shows how to add all PMU events supported a given DSP target. -
Register events
Registration of events is done by calling
itrace_register_events.Not all events may be successfully registered. For example, PMU events not supported on the specified target will not be registered, and only up to 8 PMU events may be registered at a time. Partial registration of events, which occurs when
ITRACE_RET_PARTIAL_REGISTRATIONis returned, is not considered an error: it simply means that some of the events specified by the users have not been registered yet. They may be registered in subsequent calls toitrace_register_events. -
Define sections to monitor
The
itrace_start_sectionanditrace_end_sectionare used to monitor:- CPU activity for code sections defined from the CPU source
- DSP activity for code sections defined from the DSP source
- DSP activity for code sections defined from the CPU source
itrace supports multiple concurrent profiler instances. itrace profiling APIs allow the user to specify the target instance, or (by passing NULL for the instance) to let itrace use its default profiling instance (chosen from existing profiling instances running on the specified domain). Usage of a default profiler can simplify user code and is adequate for many common profiling scenarios, but both approaches are shown in the example.
Note: Monitoring DSP activity by defining a code section from the CPU is useful when the DSP source is not accessible. For example, the user may surround a FastRPC call with
itrace_start_sectionanditrace_end_sectioncalls to monitor DSP activity for the entire duration of the FastRPC call.The itrace example also illustrates how to use the
itrace_start_section_no_eventsanditrace_end_section_no_eventsAPIs. These APIs are also intended to monitor code sections but they are optimized for speed and designed to only monitor the time and pcycle counts of each code sections. -
Start a DSP periodic sampler that will measure all registered events at regular intervals.
This is accomplished by calling
itrace_start_periodic_events_reader, passing the DSP profiler instance, and specifying the sampler polling period and thread priority. -
Use the multipass extensions
The hardware can only monitor up to 8 PMU events at a time. Beyond that, it is necessary to register multiple groups of PMU events that will be monitored one group at a time. The multipass extensions automate the process of registering successively different groups and rerunning the section of code delimited by
ITRACE_MULTI_PASS_START_LOOPandITRACE_MULTI_PASS_END_LOOP.To demonstrate the use of the multipass extensions, use the
-mor--multipasscommand-line argument when invoking the executable. itrace will then automatically re-run the code defined between the twoMULTI_PASSmacros as many times as necessary to monitor all events specified by the user. -
Load events from file
In some cases it may be desirable to specify which events to monitor from a file. This allows to monitor different sets of events without having to recompile the code. It also makes the registration of hundreds of events easier than programmatically.
Using
-for--load_events_from_filecommand-line argument will pull the list of events that need to be registered fromdsp_events_config.txtandcpu_events_config.txt. -
Register events from the DSP
While it is most common to setup itrace and specify which events to monitor from the CPU, it is also possible to add events to monitor from the DSP directly. This is especially useful when defining custom events, which allow a user to provide their own functions for collecting metrics.
To demonstrate this approach, use the
-ror--register_events_from_dspcommand-line argument. This will unregister events previously registered on the CPU and register new events from the DSP instead. -
Monitor all PMU events
Using
-por--monitor_all_pmu_eventsregisters all DSP PMU events supported on the DSP itrace on which itrace executes. Since hundreds of PMUs are available for each architecture, make sure to combine this option with the-mmultipass option: without the-moption, itrace will only run the monitored code once and thus only collects data on the first 8 specified PMU events. -
Automate itrace
Using
-aor--automatedutilizes the prebuilt binarylibritrace_constructor_skel.soto take advantage of full automation using itrace. Upon the first dlopen call in the example, the constructor binary triggers itrace setup via anitrace_automated_setupcall (based on the configuration specified initrace_config.txt). At program exit, anitrace_automated_teardowncall is triggered to flush logs and cleanup the loggers and profilers that have been set up.
Running the example
The example comes with a walkthrough script called itrace_example_walkthrough.py. Please review the generic setup and walkthrough scripts instructions to learn more about setting up your device and using the script.
To run the example, execute the walkthrough script itrace_example_walkthrough.py. This script automates the steps of building, running and signing the device. The script also pulls from the device the itrace_results folder containing all the files generated by itrace.
The example provides a script at ${HEXAGON_SDK_ROOT}/examples/itrace/tests/validation_script.py which tests all the arguments supported by the itrace_example.
Explore the arguments supported by validation_script.py using:
python validation_script.py -h
For each of the command executed using the validation_script we get:
- The standard outputs stored at
${HEXAGON_SDK_ROOT}/examples/itrace/outputsfolder. - The
itrace_resultsstored at${HEXAGON_SDK_ROOT}/examples/itrace/resultsfolder. - The
logcatlogs stored at${HEXAGON_SDK_ROOT}/examples/itrace/logcat_logsfolder.
Notes:
- itrace is not supported on the simulator
- By default, the itrace example uses the prebuilt itrace binaries provided in the Hexagon SDK. To provide an alternate location for the itrace source or prebuilt binaries, set the environment variable
ITRACE_DIRaccordingly.
Visualizing the results
Event counts
when interpreting any of the itrace output files, it is important to remember that most events count resources are shared accross the entire domain. As a result, when monitoring an event on a given thread, contributions from other threads will also be counted.
For example, one of the events monitored in the itrace example is ITRACE_DSP_EVENT_PMU_COMMITTED_FPS. This event monitors the number of scalar float operations. The memcpy function that is monitored in the itrace example does not perform any float operation. However, that function may occasional run in parallel with itrace_example_float_loop and when that is the case, the memcpy function will show a positive count for ITRACE_DSP_EVENT_PMU_COMMITTED_FPS.
File names
The walkthrough script sets the itrace root filename to /vendor/bin/itrace_results/itrace_example. This means that the example will generate an itrace_results folder under /vendor/bin in which it will generate its various itrace output files: itrace_output.json, itrace_output.csv, etc.
Naming conventions
itrace adopts the following naming conventions in its reports:
-
sanderefer the event counter values measured at the start and end of a section. These values are generated when the processing mode of an event is set toRAW. -
drefers to the delta between a counter value measured at the end of a section and its value at the start. This approach is used when the processing mode of an event is set toDELTA. -
d/trefers to the delta between a counter value measured at the end of a section and its value at the start divided by the section duration (in microseconds). This approach is used when the processing mode of an event is set toNORMALIZED. -
PMU event names are listed as
: where is the hexadecimal number of the event and its name. The field is omitted for PMU events registered by their opcodes and not their itrace id.
CSV report
The CSV file reports for all executed DSP sections the DSP event values that were measured. If the processing mode of an event is set to RAW, two values are reported for the event: the values measured at the start and end of the section. Otherwise, only one value is reported, derived from the difference between the value measured at the end and start of the section.
TIME_US:s and TIME_US:e refer to the start and end time (in microseconds) of a section.
>adb pull /vendor/bin/itrace_results .

>more itrace_output.csv

CDSP v68
SECTION,TIME_US:s,TIME_US:e,:STACK_FREE_B:s,:STACK_FREE_B:e,0x50:COMMITTED_FPS:d,0x42:AXI_WRITE_REQUEST:d,0x3:COMMITTED_PKT_ANY:d,0x3f:AXI_LINE128_READ_REQUEST:d,0x46::d,0x100:HVX_ACTIVE:d
Begin test on DSP
memcpy,180647804.322917,180650377.916667,936,920,0,17103,461824,16934,16581,0
memcpy,180667918.489583,180670378.958333,936,920,0,12716,396646,16711,12696,0
memcpy,180684860.625000,180687419.062500,936,920,0,12750,396645,16700,12731,0
itrace_example_float_loop,180701943.958333,180704966.770833,5280,5240,1000000,33841,2795434,36922,30363,0
float_loop,180701941.770833,180704970.729167,5264,5240,1000000,33961,2799913,37059,30473,0
JSON (timeline) report
The JSON file captures the DSP and CPU activity on a timeline. The JSON file may be open from the Chrome browser with Perfetto by clicking on Open trace file to select itrace_output.json.
You should be able to see four sets of rows containing Statistics and Process information for the CPU and DSP.
Any of these rows can be expanded to see detailed activity:
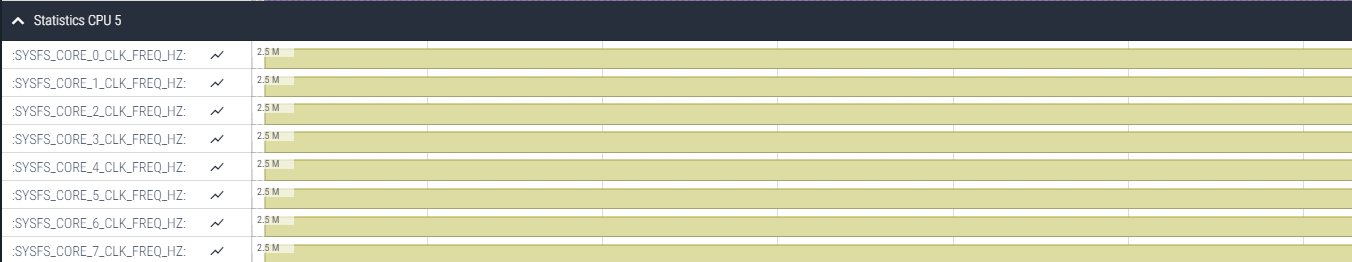
- The CPU Statistics timeline shows the clock frequency of all CPU cores
- The CPU and DSP Process timelines show when a given monitored section is active on a given software thread
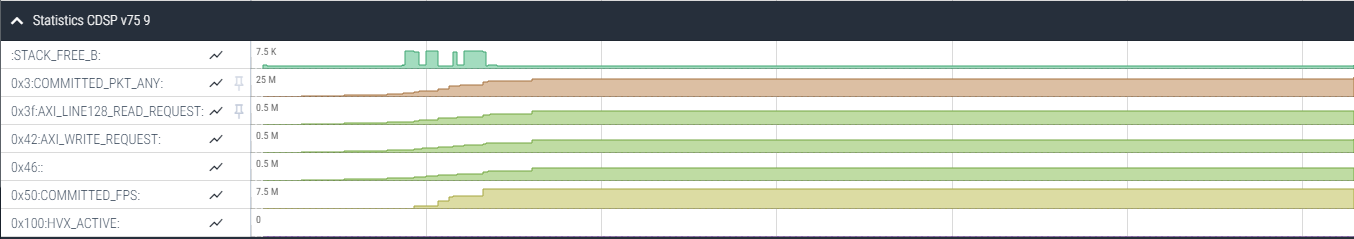
- The DSP Statistics timeline shows the registered event values measured by the sampler and at the start and end of any monitored section
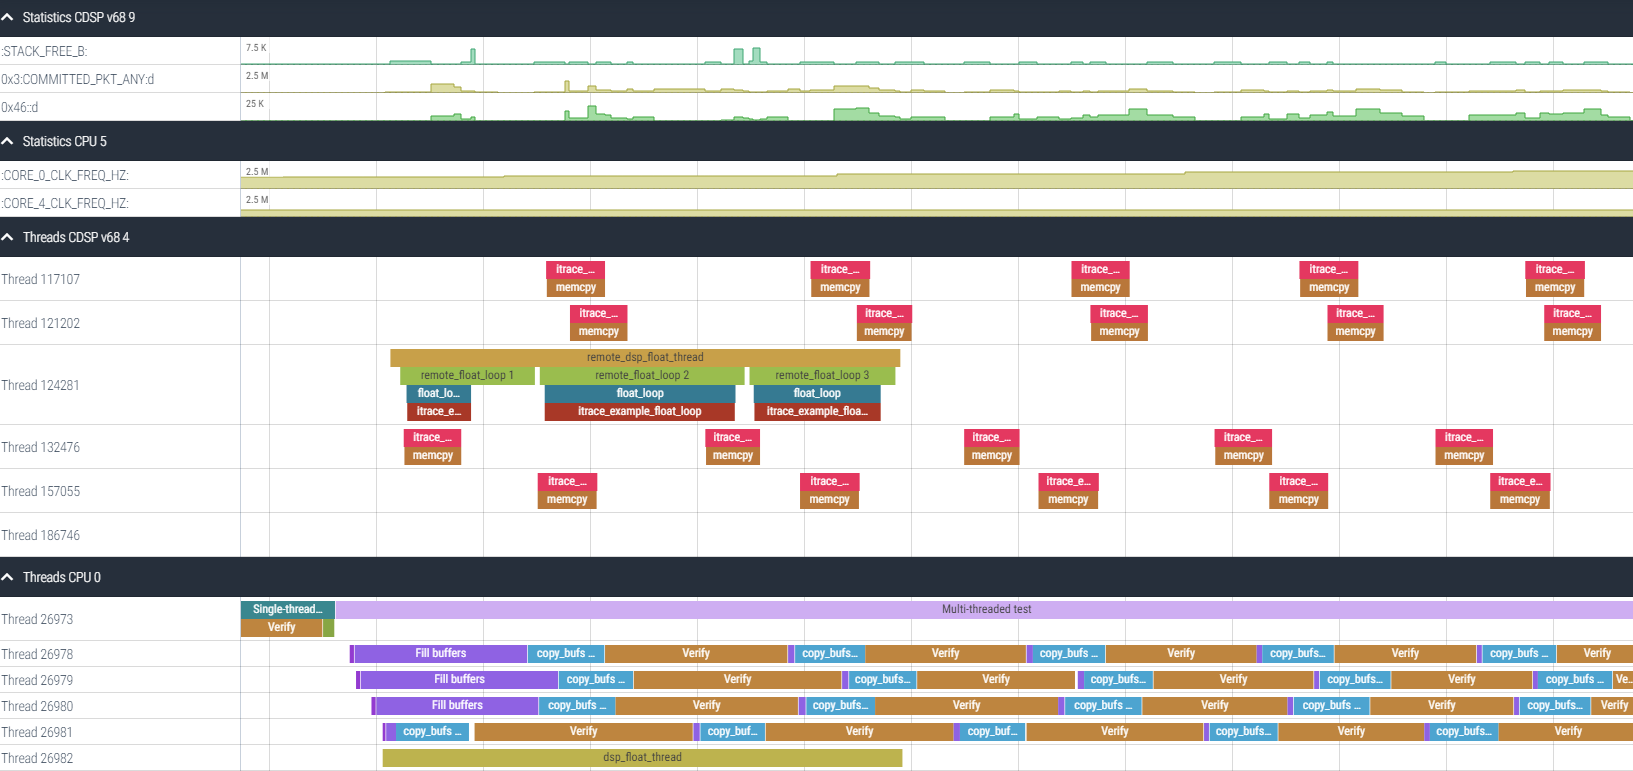
Additionally the user may click on any DSP section to obtain the same details as those reported in the CSV file for the selected section.
The CPU statistics below show for example how two of the CPU hardware thread clocks change over the duration of the test.
The DSP statistics below show how two PMU and two non PMU counters evolve over time.
Flamegraph reports
The Flamegraph files are generated in two steps:
- The
itrace_exampleexecutable generates text files in atmpfolder of the output folder - The
flamegraph_post_process.shshell script turns these text files into Flamegraph and Icicle files
Before running flamegraph_post_process.sh make sure to download the Flamegraph project. Then update FLAMEGRAPH_DIR to point to the downloaded location and also update if necessary ITRACE_RESULTS to point to the output folder generated by the itrace_example executable.
After execution of the script, you should obtain one Flamegraph and one Icicle graph for each text file present in the tmp folder. These files will provide a breakdown of resource consumption per itrace code section for each monitored itrace event.
In addition to reports on each registered event itrace will generate the following reports:
*___TIME_NS.svg: Breakdown of the time in nanoseconds spent executing each monitored section*___PCYCLES_30b.svg: Breakdown of the 30 LSBs of thepcyclecounts for all sections monitored with theitrace_start_section_no_eventsanditrace_end_section_no_eventsAPIs
gprof reports
gprof output files contain a flat profile and a call graph report similar to the gprof tool.
As with the Flamegraph output, you should be getting one gprof report for the time and pcycles metrics and each registered event that detail resource consumption for each monitored code section.
Please refer to any online documentation on gprof for more details on these reports.
Autoinstrumentation support
itrace is able to leverage compiler instrumentation features on the DSP and/or CPU side to monitor all functions of a given library.
DSP auto instrumentation
itrace leverages the Hexagon compiler Light Weight Instrumentation (LWI) feature to automatically monitor all functions in a DSP source file or library. To enable this feature in the itrace example, simply set the environment variable USE_LWI before building the code. Alternatively, you can also invoke the walkthrough script with the -l or --use_lwi option.
This will result in compiling the itrace_example project with the -fprofile-lwi-generate-func and -flwi-fp flags. This means that all DSP source of the itrace example project will have LWI enabled. As a result, all functions present in libitrace_example_skel.so will be monitored with itrace by calling itrace_start_section_no_events and itrace_end_section_no_events at the entry point and all exit points of each DSP function.The 8.7 Hexagon tools also support an additional set of attributes, lwi_func and no_lwi_func:
- Functions with the
lwi_funcattribute and compiled with flag-flwi-attrwill be monitored by itrace even when-fprofile-lwi-generate-funcis not present - Functions with the
no_lwi_funcattribute and compiled with flag-flwi-attrwill be not be monitored by itrace even when-fprofile-lwi-generate-funcis present
DSP auto instrumentation is not supported on Windows host machine.
CPU auto instrumentation
itrace leverages the CPU compiler instrumentation feature to automatically monitor all functions in a CPU source file or library. To enable this feature in the itrace example, simply set the environment variable USE_CPU_INSTRUMENTATION before building the code. Alternatively, you can also invoke the walkthrough script with the -i or --use_cpu_instrumentation option.
This will result in compiling the itrace_example project with the -finstrument-functions flag. This means that all CPU source of the itrace example project will have CPU instrumentation enabled. As a result, all functions present in the itrace_example binaries will be monitored with itrace by calling itrace_start_section_no_events and itrace_end_section_no_events at the entry point and all exit points of each CPU function.
For Android NDK r25c, -finstrument-functions is not functional for maked build system. Please use instead cmake build system for CPU instrumentation.
Known issue
Below are the list of known issues on itrace:
-
If the FARF/DSP logs has the error below, then the DSP image of that target doesn't have the implementation for
HAP_mem_available_stackfunction and hence itrace is not supported on that target.CDSP: undefined symbol PLT #84 HAP_mem_available_stack in ./libritrace_skel.so [8500/ 3] MSG 03:53:20.317500 QDSP6/Error [ mdreloc.c 274] 120ee:08: CDSP: plt object relocation failure [8500/ 3] MSG 03:53:20.317500 QDSP6/Error [ rtld.c 834] 120ee:08: CDSP: Error: dlopen_ex failed for libritrace_skel.so (flags 2) [8500/ 3] MSG 03:53:20.317500 QDSP6/Error [ mod_table.c 556] 120ee:08: CDSP: Error 0x80000406: open_mod_table_open_dynamic failed for file:///libritrace_skel.so?ritrace_skel_handle_invoke&_modver=1.0&_dom=cdsp -
If the console output for itrace_exmaple is throwing the error below, please check the number of CPU cores present on the target:
Attempting to register event SYSFS_CORE_6_CLK_FREQ_HZ
08-25 16:37:38.642  6697  6697 D itrace  : NO O_RDONLY | O_NONBLOCK privileges on /sys/devices/system/cpu/cpu6/cpufreq/cpuinfo_cur_freq: 0xffffffff
08-25 16:37:38.642  6697  6697 D itrace  : Error registering event 6 failed
08-25 16:37:38.642  6697  6697 D itrace  : Error: event 0x6 failed to register
For example, in this case the target had only 6 cores (cpu0-cpu5), hence the attempt to monitor the clock speed of CPU 6 fails.
-
If you find the message below in logcat log, please check if the target has a DSP or not. If not, itrace is expected to fail.
07-10 06:06:00.527 16078 16078 E itrace_example: vendor/qcom/proprietary/adsprpc/src/fastrpc_apps_user.c:3092: Error 0x2: open_shell failed for domain 3 search paths used are /dsp/, /vendor/dsp/, /vendor/dsp/xdsp/ (errno No such file or directory)
07-10 06:06:00.528 16078 16078 E itrace_example: vendor/qcom/proprietary/adsprpc/src/fastrpc_apps_user.c:3304: Error 0xffffffff: apps_dev_init failed for domain 3, errno No such device, ioErr -1
07-10 06:06:00.528 16078 16078 E itrace_example: vendor/qcom/proprietary/adsprpc/src/fastrpc_apps_user.c:3430: Error 0xffffffff: open_dev (-1) failed for domain 3 (errno No such device)