|
itrace
Instrumented Trace
|


|
|
itrace
Instrumented Trace
|
|
The Instrumented Trace (itrace) library enables its users to monitor events in parallel on multiple domains of Qualcomm devices.
With the itrace library, a user can register a set of events and identify one or more code sections of interest during which to monitor the registered events. Additionally, the itrace library allows to configure a sampler that monitors registered events periodically.
The values of the monitored events are post-processed according to their respective itrace_processing_mode_t before being rendered on timelines and in statistic reports. Timelines are captured in trace files in a json format viewable with Perfetto.
Here is an example of trace output produced by itrace.

The itrace_set_target_files APIs should be used to specify the output Output file types itrace will generate. By default, all output types are generated by itrace. Each output report provides a different understanding of resource utilization. All output reports are generated in the folder itrace_results.
Note: When interpreting any of the itrace output files, it is important to remember that most events count resources are shared accross the entire domain. As a result, when monitoring an event on a given thread, contributions from other threads will also be counted. In other words, when a function reports a global event count, this count combines contributions from all threads that ran in parallel with the monitored function.
The json output is a text-based file output containing timeline data. This file should be open with Perfetto from your Chrome browser. The combined reports show the following information:
Domain Statistics rows in the timeline show post-processed event values whenever an event is measured.
Below is an example of CDSP statistics expressed in the timeline.

And below is an example of CPU statistics expressed in the timeline.

Events are measured when either of these scenarios occur:
Domain Threads rows in the timeline show when a given section is active. When sections are monitored within other sections, section activities are stacked on top of each other. Section sections may be up to 5 levels deep.
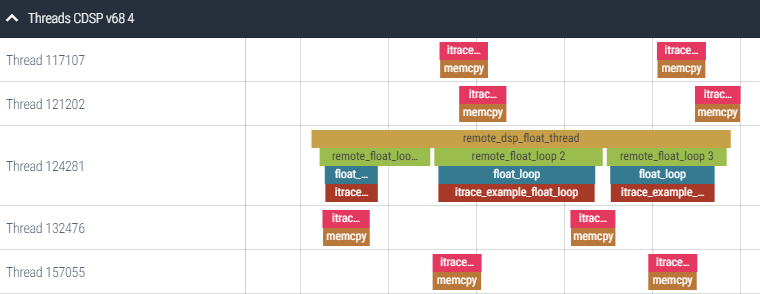
Here is an example of a DSP timeline showing CDSP thread activity.
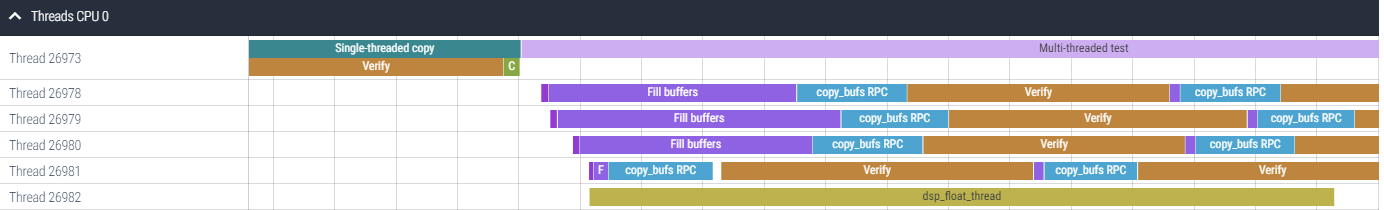
In parallel with the DSP timeline, the itrace output will show the CPU thread activity as illustrated below.
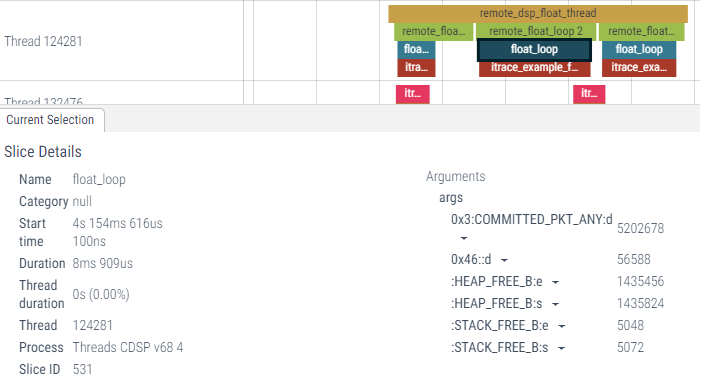
Section metrics report the post-processed event values captured at the start and end of a section, or by how much these metrics increased over the duration of the section. Section statistics are accessible from the timeline by clicking on each section.
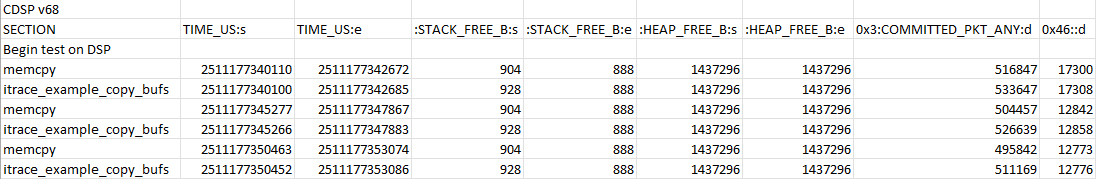
Section statistics are also reported separately in CSV files that may be open with any text editor or, preferably, a tabulator viewer like Excel.
Note: When specifiying the start or end of a section, the client may request the measured events to be returned as part of the API call. This gives additional flexibility to the user who may need access to these values programatically as well.
itrace may also generate text files compatible with Flamegraph. These text files are generated in a tmp folder of the itrace output folder as these are only intermediary files. One file is generated for each monitored event with a ITRACE_PM_DELTA or ITRACE_PM_NORMALIZED processing mode. Two additional files are generated:
The itrace example illustrates how these text file may be post-processed by Flamegraph to generate Flamegraph or Icicle output reports.
In order to generate these reports, you will need to download the Flamegraph project and run the Perl script flamegraph on one of the output from itrace. For example:
flamegraph.pl itrace_example_fg__0x50_COMMITTED_FPS.txt --title "Flamegraph for event 0x50_COMMITTED_FPS" --countname COMMITTED_FPS > itrace_example_flamegraph_0x50_COMMITTED_FPS.svg
will generate a Flame graph showing the stack trace of all code sections profiled with itrace for system-level event COMMITTED_FPS (counting the number of floating-point operations). Adding --inverted to the command line will generate an Icicle output instead.

As shown on the figure above, hovering over each entry will provide details about that section. The user may also click on any section to zoom on the call stack for that specific code section.
This view illustrates the fact that PMU counts should be interpreted with care: the PMU events currently measured by itrace are system-wide events. This means that when a given code section is profiled, all threads running in parallel during that time will also contribute to the count of the event being monitored. This is why, in the example above, memcpy is reported as having consummed floating-point operations even though that function alone does not consume any floating-point operation.
The Flamegraph output for the time (TIME_NS) metric is useful to understand at a glance which code section takes the most time to run.

As with Flamegraph output, one gprof output file is generated for each event configured with a ITRACE_PM_DELTA or ITRACE_PM_NORMALIZED processing mode, as well as time (expressed in microseconds) and pcycles (when relevant). gprof output files contain a flat profile and a call graph report as with the conventional gprof tool.
Here is for example a gprof output for the time metric:
Flat profile for event   TIME_US
    %          total           self                         total           self
total          count          count          calls     count/call     count/call   name
 1.60        1252.16        1252.16          30000           0.04           0.04   1
 1.76        2625.83        1373.66             15         175.06          91.58   12345
50.28       39233.38       39233.38             15        2615.56        2615.56   memcpy
22.21       17329.69       17329.69              3        5776.56        5776.56   itrace_example_float_loop
 0.11       17414.22          84.53              3        5804.74          28.18   float_loop
13.87       13763.75       10823.85              1       13763.75       10823.85   remote_float_loop 1
 3.20       36169.95        2497.50              1       36169.95        2497.50   remote_dsp_float_thread
 3.33       11274.53        2601.30              1       11274.53        2601.30   remote_float_loop 2
 3.63        8634.17        2833.07              1        8634.17        2833.07   remote_float_loop 3


Call graph for event   TIME_US
idx   % count          self       children        called           name
[  0]      NA            NA       78029.15         0            root [0]
                    1373.66        1252.16        15/15            12345 [2]
                   39233.38           0.00        15/15            memcpy [3]
                    2497.50       33672.45         1/1             remote_dsp_float_thread [7]
-----------------------------------------------
                    1373.66        1252.16     30000/30000         12345 [2]
[  1]    1.60       1252.16           0.00     30000            1 [1]
-----------------------------------------------
                        NA        78029.15        15/15            root [0]
[  2]    3.37       1373.66        1252.16        15            12345 [2]
                    1252.16           0.00     30000/30000         1 [1]
-----------------------------------------------
                         NA       78029.15        15/15            root [0]
[  3]   50.28       39233.38          0.00        15            memcpy [3]
-----------------------------------------------
                       84.53      17329.69         3/3             float_loop [5]
[  4]   22.21       17329.69          0.00         3            itrace_example_float_loop [4]
-----------------------------------------------
                    10823.85       2939.89         1/3             remote_float_loop 1 [6]
                     2601.30       8673.23         1/3             remote_float_loop 2 [8]
                     2833.07       5801.09         1/3             remote_float_loop 3 [9]
[  5]   22.32          84.53      17329.69         3            float_loop [5]
                    17329.69          0.00         3/3             itrace_example_float_loop [4]
-----------------------------------------------
                    2497.50       33672.45         1/1             remote_dsp_float_thread [7]
[  6]   17.64      10823.85        2939.89         1            remote_float_loop 1 [6]
                      84.53       17329.69         1/3             float_loop [5]
-----------------------------------------------
                        NA        78029.15         1/1             root [0]
[  7]   46.35       2497.50       33672.45         1            remote_dsp_float_thread [7]
                   10823.85        2939.89         1/1             remote_float_loop 1 [6]
                    2601.30        8673.23         1/1             remote_float_loop 2 [8]
                    2833.07        5801.09         1/1             remote_float_loop 3 [9]
-----------------------------------------------
                    2497.50       33672.45         1/1             remote_dsp_float_thread [7]
[  8]   14.45       2601.30        8673.23         1            remote_float_loop 2 [8]
                      84.53       17329.69         1/3             float_loop [5]
-----------------------------------------------
                    2497.50       33672.45         1/1             remote_dsp_float_thread [7]
[  9]   11.07       2833.07        5801.09         1            remote_float_loop 3 [9]
                      84.53       17329.69         1/3             float_loop [5]
Note there are also gprof-like reports generated for each itrace event. Here is for example a report for the COMMITTED_FPS PMU event:
Flat profile for event 0x50  COMMITTED_FPS
    %          total           self                         total           self             total             total
total          count          count          calls     count/call     count/call     time(us)/call    count/time(us)     name
40.42        4070823        4070823             15      271388.19      271388.19           2615.56            103.76     memcpy
59.57        6000073        6000073              3     2000024.38     2000024.38           5776.56            346.23     itrace_example_float_loop
 0.00        6000073              0              3     2000024.38           0.00           5804.74            344.55     float_loop
 0.00        1000041             19              1     1000041.00          19.00          13763.75             72.66     remote_float_loop 1
 0.01        6001322           1211              1     6001322.00        1211.00          36169.95            165.92     remote_dsp_float_thread
 0.00        3000054             19              1     3000054.00          19.00          11274.53            266.09     remote_float_loop 2
 0.00        2000016              0              1     2000016.00           0.00           8634.17            231.64     remote_float_loop 3


Call graph for event 0x50  COMMITTED_FPS
 idx   % count          self       children        called           name
[  0]      NA             NA       10072145         0            root [0]
                          NA             NA        15/15            12345 [2]
                     4070823              0        15/15            memcpy [3]
                        1211        6000111         1/1             remote_dsp_float_thread [7]
-----------------------------------------------
                          NA             NA     30000/30000         12345 [2]
[  1]      NA             NA             NA     30000            1 [1]
-----------------------------------------------
                          NA       10072145        15/15            root [0]
[  2]      NA             NA             NA        15            12345 [2]
                          NA             NA     30000/30000         1 [1]
-----------------------------------------------
                          NA       10072145        15/15            root [0]
[  3]   40.42        4070823              0        15            memcpy [3]
-----------------------------------------------
                           0        6000073         3/3             float_loop [5]
[  4]   59.57        6000073              0         3            itrace_example_float_loop [4]
-----------------------------------------------
                          19        1000022         1/3             remote_float_loop 1 [6]
                          19        3000035         1/3             remote_float_loop 2 [8]
                           0        2000016         1/3             remote_float_loop 3 [9]
[  5]   59.57              0        6000073         3            float_loop [5]
                     6000073              0         3/3             itrace_example_float_loop [4]
-----------------------------------------------
                        1211        6000111         1/1             remote_dsp_float_thread [7]
[  6]    9.93             19        1000022         1            remote_float_loop 1 [6]
                           0        6000073         1/3             float_loop [5]
-----------------------------------------------
                          NA       10072145         1/1             root [0]
[  7]   59.58           1211        6000111         1            remote_dsp_float_thread [7]
                          19        1000022         1/1             remote_float_loop 1 [6]
                          19        3000035         1/1             remote_float_loop 2 [8]
                           0        2000016         1/1             remote_float_loop 3 [9]
-----------------------------------------------
                        1211        6000111         1/1             remote_dsp_float_thread [7]
[  8]   29.79             19        3000035         1            remote_float_loop 2 [8]
                           0        6000073         1/3             float_loop [5]
-----------------------------------------------
                        1211        6000111         1/1             remote_dsp_float_thread [7]
[  9]   19.86              0        2000016         1            remote_float_loop 3 [9]
                           0        6000073         1/3             float_loop [5]
-----------------------------------------------
Please refer to any online documentation on gprof for more details on these reports.
The itrace library is designed to monitor events on various domains.
Event definitions are domain-specific. In the case of the DSP for example, there are four kinds of itrace_event_t.
All published PMU events are defined and supported by the itrace library with the DSP PMU event definitions. For example, if the client registers event id ITRACE_DSP_EVENT_PMU_COMMITTED_PKT_ANY, the library will monitor the number of packets that are committed by any thread.
In the profiling reports generated by the logger, published PMU events are reported both with their names and corresponding opcodes. For example: 0x3:COMMITED_PKT_ANY:.
Note: some events are supported on some architectures and not others. The itrace library will identify at registration time which published events are supported on the domain being monitored and will only register those that are valid. For more details on the registration mechanism, see itrace_register_events.
The client may provide directly as the event_id the opcode of any PMU event, pubished or not. For example, if the client registers event id 0x3 (which corresponds to the same COMMITED_PKT_ANY event as above), the library will monitor the number of packets that are committed by any thread.
In the profiling reports, PMU events registerd by opcodes are reported by their opcodes only. For example: 0x3.
The library includes Non-PMU DSP event definitions. For example, if the client registers event id ITRACE_DSP_EVENT_HEAP_FREE, the library will monitor the number of free bytes of heap memory.
The library supports custom DSP events. These events, identified with id ITRACE_DSP_EVENT_CUSTOM, enable a client to monitor its own set of events. For each custom event, the client is responsible for providing the implementation and its context as part of the itrace_event_t.
Note: Custom events need to be registered from the DSP domain.
The library includes CPU event definitions to monitor CPU events. For example, if the client registers event id ITRACE_CPU_EVENT_CORE_0_CLK_FREQ_HZ, the library will monitor the clock frequency (in Hz) of core 0.
The client can create one or more profiler instance for each domain. The domains supported today are the DSPs (CDSP, ADSP, etc.) and the application processor (CPU). Each profiler instance maintains its separate log and set of events to monitor. Domains are specified using the IDs defined in the Hexagon SDK remote.h file. Examples of such IDs include CDSP_DOMAIN_ID or ADSP_DOMAIN_ID. To specify a domain not already present in remote.h, such as the CPU domain, use the Domain extensions.
The domain on which a profiler instance runs does not have to be the local domain from which the profiler instance was created. This approach allows a client, for example, to specify from the application processor the start and end of code sections running on the CDSP and have the library monitor CDSP-specific events such as PMU events without having access to the DSP source or requiring any recompilation of the DSP source code.
All logger-related APIs are described in the Profiler APIs section.
A logger instance is responsible for parsing buffers of events collected by one or more profiler instances and generating output files enabling a user to visualize the activity on one or more domains. Each profiler instance needs to be associated to one profiler instance; a logger instance may be associated to one or more profiler instances.
All logger-related APIs are described in the Logger APIs section.
The itrace library is also capable to run the same code block multiple times in order to capture different events on each run. The multipass support serves multiple purposes. For example, it allows to collect data from a large number of PMUs even though only 8 PMU events may be monitored at a given time on a given DSP. In other cases, it may be useful to monitor events on the same application run multiple times as resource consumption may vary from one run to the next.
Multi-pass runs are supported through an additional couple of macros that extend the core set of the itrace library and that are described in the Multipass extension section.
This section provides a couple of examples where we monitor the same DSP activity in a few different ways.
This example monitors DSP activity from the CPU.
// CPU code

#include "itrace.h"

itrace_logger_handle_t logger_handle;
itrace_open_logger(LOCAL_DOMAIN_ID, &logger_handle);               // Note: CPU_DOMAIN_ID would have the same effect
itrace_set_root_filename(logger_handle, "dsp_from_cpu");

itrace_profiler_handle_t profiler_handle;
itrace_open_profiler(logger_handle, CDSP_DOMAIN_ID, 0, &profiler_handle);

itrace_add_event_by_id(profiler_handle,ITRACE_DSP_EVENT_HEAP_FREE);              // Monitor how much free heap memory is available
itrace_add_event_by_id(profiler_handle,ITRACE_DSP_EVENT_PMU_COMMITTED_PKT_ANY);  // Monitor published PMU event COMMITTED_PKT_ANY=0x3
itrace_add_event_by_id(profiler_handle,0x123);                                   // Monitor unnamed (published or unpublished) PMU event 0x123

int num_registered_events=0;
itrace_event_t attempted_to_register_dsp_events[3];
itrace_register_events(dsp_profiler_handle, attempted_to_register_dsp_events, &num_registered_events);
if (num_registered_events!=3) {
    printf("Not all events could be registered. This is unexpected.\n");
    return;
}
itrace_start_section(profiler_handle, "DSP section monitored from CPU", NULL);
fastrpc_call_to_dsp_function_foo();                    // Call to some DSP function monitored from CPU
itrace_end_section(profiler_handle, NULL);
itrace_close_profiler(profiler_handle);
itrace_close_logger(logger_handle);
In this code sample, the client requests itrace to monitor three DSP events when running fastrpc_call_to_dsp_function_foo.
After the code has been executed, the library should have produced a dsp_from_cpu.json trace file and a dsp_from_cpu.csv CSV file. The trace file will show DSP Threads and DSP statistics timelines side by side.
The DSP Thread timeline will show over time when fastrpc_call_to_dsp_function_foo was running. Clicking on it will show the heap memory that was available before and after calling that function, and by how much the published PMU counter COMMITTED_PKT_ANY and the unnamed counter 0x123 increased over the duration of the function. The DSP Statistics timeline will represent the same metrics on thee separate rows (":heap free (B):", "0x3: COMMITTED_PKT_ANY:d", and "0x123::d").
Note how each event name is of the form [id]:[name]:[processing_mode], where each of the field may be omitted if unknown or irrelevant. See itrace_event_t for more details on this format.
This example monitors DSP activity from the DSP itself.
In order to perform the same activity and metrics from within the DSP source, the code above remains almost identical except for the monitoring of the function previously done on the CPU:
// CPU code
...
itrace_start_section(profiler_handle, "DSP section monitored from CPU", NULL);
fastrpc_call_to_dsp_function_foo();                             // Call to DSP function monitored from CPU
itrace_end_section(profiler_handle, NULL);
...
becomes
// CPU code
...
fastrpc_call_to_dsp_function_foo();                             // Call to DSP function monitored from DSP
...

// DSP code

#include "itrace.h"
...
dsp_function_foo() {
    itrace_start_section(NULL, "DSP section monitored from DSP", NULL);
    // dsp_function_foo code here
    itrace_end_section(NULL, NULL);
}
The output from the itrace library will be similar to what was produced in the first example.
Note that there could be many variations achieving yet the same results:
  itrace_profiler_handle_t profiler_handle;
  itrace_open_profiler(logger_handle, LOCAL_DOMAIN_ID, 0, &profiler_handle);
Specifying a handle to an existing profiler instance instead of passing a NULL
Passing a NULL instructs the library to use the default profiler instance. (Such instance must already have been opened however.) Passing a profiler handle instead allows to monitor independently different applications running on the same domain.
itrace_start_section(profiler_handle, "DSP section monitored from DSP", NULL);
// dsp_function_foo code here
itrace_end_section(profiler_handle, NULL);
Specifying a pointer to a itrace_measured_events_t instance instad of passing a NULL
Passing a non-null itrace_measured_events_t instance instructs the library that the user needs the measured metrics to be returned programatically. This approach would be used if the user needs to perform some additional processing with the metrics being monitored by itrace in addition to them being captured in the reports.
Hundreds of PMU events are available on each architecture.
Different sets of events enable the user to monitor different areas of the DSP. The events described in this section are useful to provide a usage overview of various areas. All these events are also defined in configs/commonly_used_pmus.txt, which itrace can load using itrace_add_events_from_file.
Monitoring the following events will gain insight into how the DSP's compute resources are being used:
CYCLES_1_THREAD_RUNNING
CYCLES_2_THREAD_RUNNING
CYCLES_3_THREAD_RUNNING
CYCLES_4_THREAD_RUNNING
CYCLES_5_THREAD_RUNNING
CYCLES_6_THREAD_RUNNING
COMMITTED_PKT_ANY
In order to monitor these events in itrace, you can load a file with the following contents using itrace_add_events_from_file :
The same can be done programmatically:
itrace_add_event_by_id(dsp_profiler_handle,ITRACE_DSP_EVENT_PMU_CYCLES_1_THREAD_RUNNING);
itrace_add_event_by_id(dsp_profiler_handle,ITRACE_DSP_EVENT_PMU_CYCLES_2_THREAD_RUNNING);
itrace_add_event_by_id(dsp_profiler_handle,ITRACE_DSP_EVENT_PMU_CYCLES_3_THREAD_RUNNING);
itrace_add_event_by_id(dsp_profiler_handle,ITRACE_DSP_EVENT_PMU_CYCLES_4_THREAD_RUNNING);
itrace_add_event_by_id(dsp_profiler_handle,ITRACE_DSP_EVENT_PMU_CYCLES_5_THREAD_RUNNING);
itrace_add_event_by_id(dsp_profiler_handle,ITRACE_DSP_EVENT_PMU_CYCLES_6_THREAD_RUNNING);
itrace_add_event_by_id(dsp_profiler_handle,ITRACE_DSP_EVENT_PMU_COMMITTED_PKT_ANY);
itrace_register_events(dsp_profiler_handle, registered_events_array, &num_registered_events);
itrace can monitor up to 8 PMU events at a time. Monitoring more than 8 PMU events at a time can only be done by re-running a block of code multiple times in sets of up to 8 PMU events. This approach allows to get a more complete view of the resource utilization.
With respect to compute power resources, two additional PMU events provide a useful overview, allowing to assess HVX and HMX utilization. If you do not need to measure compute activity when only one thread is running for example, you may want to monitor HVX_ACTIVE and HMX_ACTIVE instead of CYCLES_1_THREAD_RUNNING thus having a of group of 8 events to monitor. Alternatively, you may simply want to monitor all of these PMU events by letting itrace iterate over all added events for the code section identified with the multi-pass APIs ITRACE_MULTI_PASS_START_LOOP and ITRACE_MULTI_PASS_END_LOOP.
The same approach may be followed with the other sets of events described in the next sessions: either restrain yourself to monitoring 8 PMU events at a time, or use the multi-pass approach to monitor a larger number of PMU events by monitoring the same code multiple times with different events.
It may also be useful to combine PMU counters together to obtain derived metrics. (The 'Derived Stats' section of a Hexagon profiler report compute such metrics.)
In this section and all subsequent Derived metrics sections, PMU event names listed in the equations refer to the difference between the counts of the events at the end and start of a monitored code section (calculated with itrace when using the DELTA processing mode).
For example, with:
1T_CPP=CYCLES_1_THREAD_RUNNING/COMMITTED_PKT_1_THREAD_RUNNING
1T_CPP represents the average CPP (Cycle Per Packet) when one thread is running. Similar metrics may be computed for n threads running in parallel, with n between 1 and 6.
The overall CPP may also be computed by dividing the total pcycle count (tracked in itrace as the ITRACE_DSP_EVENT_PCYCLES, or also obtained by adding up all CYCLES_<n>_THREAD_RUNNING counts) by the COMMITTED_PKT_ANY count:
CPP=PCYCLES/COMMITTED_PKT_ANY
CPP metrics are useful to identify code regions where compute resources are underutilized: a high CPP is indicative of code sections with a large number of stalls, which are usually good candidates for optimizations.
Monitoring the following events will gain insights into data traffic between the DSP and DDR:
AXI_LINE256_READ_REQUEST
AXI_LINE128_READ_REQUEST
AXI_LINE64_READ_REQUEST
AXI_LINE32_READ_REQUEST
AXI_LINE256_WRITE_REQUEST
AXI_LINE128_WRITE_REQUEST
AXI_LINE64_WRITE_REQUEST
AXI_LINE32_WRITE_REQUEST
The AXI counters may be combined to compute the total number of bytes read from or written to the AXI bus:
AXI_READ_BYTES = AXI_LINE32_READ_REQUEST*32 + AXI_LINE64_READ_REQUEST*64 + AXI_LINE128_READ_REQUEST*128 + AXI_LINE256_READ_REQUEST*256
               + (AXI_READ_REQUEST - AXI_LINE32_READ_REQUEST - AXI_LINE64_READ_REQUEST - AXI_LINE128_READ_REQUEST - AXI_LINE256_READ_REQUEST)*8

AXI_WRITE_BYTES = AXI_LINE32_WRITE_REQUEST*32 + AXI_LINE64_WRITE_REQUEST*64 + AXI_LINE128_WRITE_REQUEST*128
                + (AXI_WRITE_REQUEST - AXI_LINE32_WRITE_REQUEST - AXI_LINE64_WRITE_REQUEST - AXI_LINE128_WRITE_REQUEST)*8
The counters may also be used to compute the total number of bus read and write transactions:
TOTAL_BUS_READS=AXI_READ_REQUEST + AHB_READ_REQUEST
TOTAL_BUS_WRITES=AXI_WRITE_REQUEST + AHB_WRITE_REQUEST
Note: You may also want to do a test run of your application monitoring the AXI2_*_REQUEST events listed in itrace_dsp_events_pmu.h that track requests made to the secondary AXI master. If your application uses that master, you will need to include those counters as well in the equations above.
Monitoring the following events will gain insights into HVX usage and what causes it to stall:
HVX_ACTIVE
HVX_REG_ORDER
HVX_ACC_ORDER
HVX_VTCM_OUTSTANDING
HVX_LD_L2_OUTSTANDING
HVX_ST_L2_OUTSTANDING
HVX_ST_FULL
HVXST_VTCM_CONFLICT
If using a multi-pass approach is an option, the following expanded group of events is useful to monitor:
HVX_ACTIVE
HVX_REG_ORDER
HVX_ACC_ORDER
HVX_VTCM_OUTSTANDING
HVX_LD_L2_OUTSTANDING
HVX_ST_L2_OUTSTANDING
HVX_ST_FULL
HVX_SCATGATH_FULL
HVX_SCATGATH_IN_FULL
HVXST_VTCM_CONFLICT
HVX_VOLTAGE_UNDER
HVX_POWER_OVER
HVX_VOLTAGE_VIRUS_OVER
Monitoring the following events will gain insights into the use of the scatter-gather processing unit:
SCATGATH_ACTIVE
HVX_VTCM_OUTSTANDING
SCATGATH_OUTSTANDING
HVX_SCATGATH_FULL
HVX_SCATGATH_IN_FULL
SCATGATHBANK_RD
SCATGATHBANK_MODIFY_RD
SCATGATHBANK_WR
***Note: *** It is useful to also monitor the additional HVX_ACTIVE event to understand how the scatter-gather activity relates to HVX usage but that does bring the count of PMU events to 9 in one group.
Monitoring the following two sets of events will provide two views on L2 cache utilization:
HVXLD_L2
HVXST_L2
HVXLD_L2_MISS
HVXST_L2_MISS
HVXLD_L2_SECONDARY_MISS
L2FETCH_ACCESS
L2FETCH_MISS
L2FETCH_COMMAND
L2FETCH_COMMAND_KILLED
L2FETCH_COMMAND_OVERWRITE
itrace leverages the Hexagon compiler Leight Weight Instrumentation (LWI) feature to automatically monitor all functions in a DSP source file or library. This feature is illustrated in the itrace example.
To enable this feature in any project, take the following steps:
lwi.config and lwiconfig.ini config files to your project-flwi-fp -fprofile-lwi-generate-func-late$HEXAGON_VARIANT) to the same location as your executableThe itrace library may add an overhead of up to a thousand cycles–the actual overhead depends on how many and which events are being monitored–whenever monitoring a code section. As a result, itrace is usually not suited to monitor DSP functions that take less than a few thousand cycles to execute.
One pair of APIs, itrace_start_section_no_events and itrace_end_section_no_events, have a lower overhead (around 110 cycles for the pair of APIs). These APIs may be combined with the other itrace APIs, thus allowing to monitor cycle counts at a finer granularity, and a more complete set of events at larger granularity.
Both the CPU and DSP itrace libraries are versioned with the following format <ITRACE_VERSION_MAJOR>.<ITRACE_VERSION_MINOR>. The version of the library of each profiler instance is reported in the metadata output file (.txt output).
Note: The itrace library version is different from the library security version, which is used to track security version of the itrace skel. The library security version follows the same format as the library version: <ITRACE_SECURITY_VERSION_MAJOR>.<ITRACE_SECURITY_VERSION_MINOR>
The security version of a skel may be retrieved by running hexagon-llvm-readelf --notes
This section illustrates how to integrate the itrace library into a project alongside LWI. itrace leverages the Hexagon compiler Light Weight Instrumentation (LWI) feature to automatically monitor all functions in a DSP source file or library.
A couple of changes need to be made to the HLOS side code to include itrace API calls:
itrace_automated_setup API call takes a setup file (such as the file itrace_config_template.txt provided alongside the library), and sets up an itrace configuration based on the specifications of the file. Click here for more information.itrace_automated_teardown API call flushes the logs to the output directory specified by the configuration file passed to itrace_automated_setup and cleans up itrace.The following steps are part of the build process:
lwi.config and lwiconfig.ini from ${ITRACE_DIR}/configs/ to your project directory as the linker expects these files in the directory from where it executes. It is necessary to also include ${ITRACE_DIR}/inc to the list of included directories.-flwi-fp -fprofile-lwi-generate-func. If using 8.7 Hexagon Tools or later, also include the -flwi-attr flag to enable support for no_lwi_func and lwi_func attributes. These attributes may be inserted directly in the source code to disable or enable LWI instrumentation of a specific function.${HEXAGON_SDK_ROOT}/libs/itrace/prebuilts/<hlos_dir>/libitrace.so, ${HEXAGON_SDK_ROOT}/libs/itrace/prebuilts/<hlos_dir>/libritrace_reverse_skel.so, and ${HEXAGON_SDK_ROOT}/libs/itrace/deps/protobuf/libprotobuf.so) to the project's HLOS executable.${HEXAGON_SDK_ROOT}/libs/itrace/prebuilts/<dsp_dir>/libritrace_skel.so) to the project's DSP skel. NOTE: Hexagon Simulator is not supported by itrace. When linking the itrace library with a project utilizing Hexagon Simulator, it is necessary to avoid building itrace with the Hexagon Simulator Test Executable.The following steps are part of the itrace setup process:
${HEXAGON_SDK_ROOT}/libs/itrace/libitrace.so, libritrace_reverse_skel.so, and libprotobuf.so.libritrace_skel.soitrace_config_template.txtlwi.proto.bin is generated by the linker and not found under libs/itraceitrace_automated_setup.A project utilizing the default configuration file (itrace_config_template.txt) will generate an itrace output to the itrace_results folder under the directory from which the application was executed with various output files: itrace_output.json, itrace_output.csv, etc. Refer to the itrace example in the Heagon SDK for more detailed information on the results generated by itrace.
 1.8.13